Reports & Analytics See clearer. Decide better.
TekShot OS automatically collects and analyses data from many channels, turning it into clear, visual reports so your business understands what is happening and acts faster.
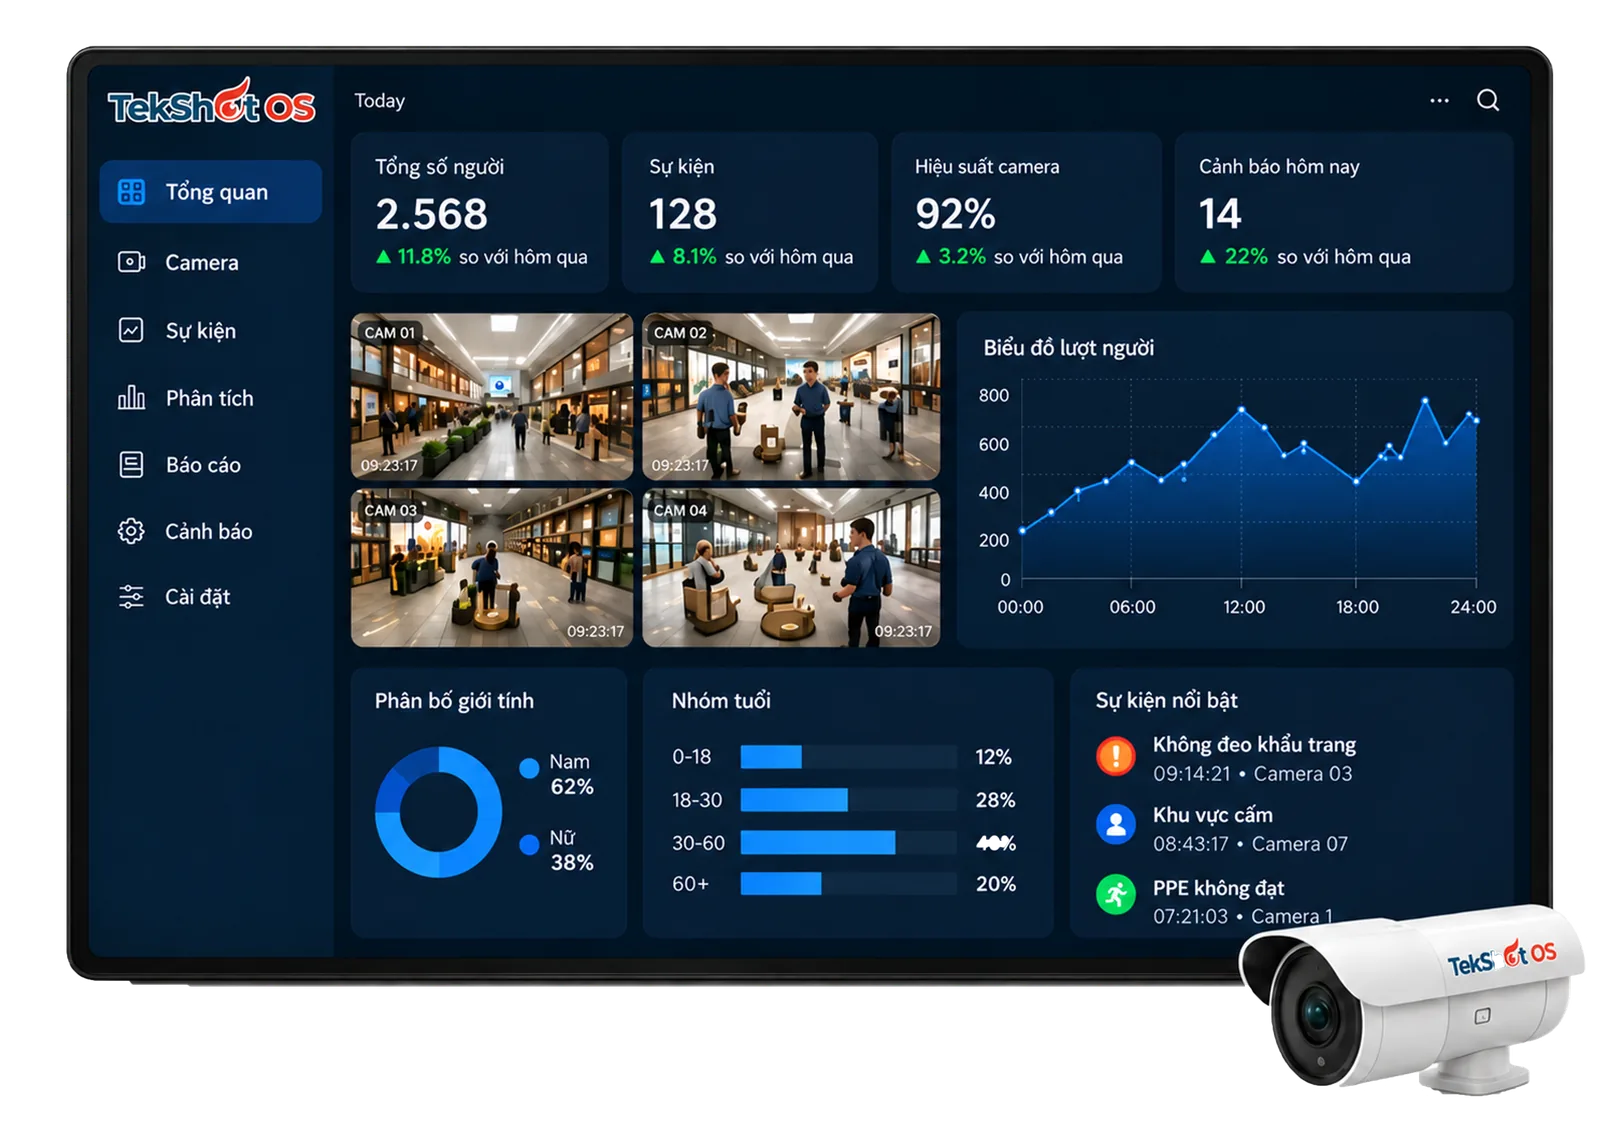
Every report you need on one screen
Choose a report group to see an example with sample data for October 2026.
Revenue over time
Customers by channel
Top performing content
-
 Video: Behind the scenes in the bakery125K · 8.4K · 320
-
 Post: Summer combo98K · 6.1K · 210
-
 Video: Production process76K · 4.2K · 180
-
 Photo: Store interior64K · 3.9K · 150
Sales report
Revenue, orders, best-sellers and returning-customer rate, pulled directly from POS and online channels.
- Revenue by day, shift and branch
- Top products and combos
- Average order value, cancellation rate
Best-selling products
Marketing report
Compare each channel and campaign: reach, engagement, cost and customers acquired.
- Performance on Facebook, TikTok, Zalo, Website
- Cost per new customer
- Best times to post
Engagement rate by channel
Content report
See which content works and which formats people love, so Studio AI can suggest your next post.
- Rank posts, videos and photos
- Topic and format analysis
- Seasonal content suggestions
Top topics this month: behind the scenes, new dishes, combo deals.
Competitor report
Insight AI tracks competitors in your area: posting frequency, engagement, promotions and prices.
Learn about Insight AI| Brand | Posts/week | Avg. engagement | Promotions |
|---|---|---|---|
| Your store | 6 | 6.8% | Breakfast combo |
| Competitor A | 9 | 4.2% | 20% off |
| Competitor B | 4 | 5.5% | Buy 1 get 1 |
| Competitor C | 3 | 2.9% | None |
Regional report
Compare branches and areas, and spot promising new sales points.

Staff report
Track workload, progress and performance of each member of your media and store teams.
See Operations & management| Team member | Tasks completed | On time | Status |
|---|---|---|---|
| Nguyễn Thị Hương | 24/25 | 96% | Good |
| Trần Văn Minh | 18/20 | 90% | Good |
| Lê Thu Trang | 15/19 | 79% | Needs attention |
| Phạm Quốc Anh | 12/12 | 100% | Good |
Custom reports
Build your own reports with drag and drop, no coding needed.
- Choose metrics, channels and time range
- Save templates and email them to managers on a schedule
- Export to PDF, Excel, PowerPoint
Automated reports, in-depth analysis
Automated reports
Daily, weekly, monthly. Scheduled email delivery.
Multi-channel comparison
Compare Facebook, TikTok, Website and more.
In-depth analysis
Customer groups, areas, time slots, content…
Forecasts & recommendations
AI suggests content, promotions, budgets…
Report export
PDF, Excel, PowerPoint. Customised to your needs.
Ready to turn data into action?
Try TekShot OS free for 7 days with all 5 AI assistants. No credit card required, deployment support within 1–7 days.